Data From: TERRA-REF, An Open Reference Data Set From High Resolution Genomics, Phenomics, and Imaging Sensors
David S. LeBauer1
Maxwell A. Burnette2
Jeffrey Demieville3
Noah Fahlgren4
Andrew N. French5
Roman Garnett6
Zhenbin Hu7
Kimberly Huynh8
Rob Kooper9
Zongyang Li10
Maitiniyazi Maimaitijiang11
Jerome Mao12
Todd C. Mockler13
Geoffrey Morris14
Maria Newcomb15
Michael J. Ottman16
Philip Ozersky17
Sidike Paheding18
Duke Pauli19
Robert Pless20
Wei Qin21
Kristina Riemer22
Gareth Scott Rohde23
William L. Rooney24
Vasit Sagan25
Nadia Shakoor26
Abby Stylianou27
Kelly Thorp28
Richard Ward29
Jeffrey W White30
Craig Willis31
Charles S Zender32
2020-07-10
1 Abstract
The ARPA-E funded TERRA-REF project is generating open-access reference datasets for the study of plant sensing, genomics, and phenomics. Sensor data were generated by a field scanner sensing platform that captures color, thermal, hyperspectral, and active flourescence imagery as well as three dimensional structure and associated environmental measurements. This dataset is provided alongside data collected using traditional field methods in order to support calibration and validation of algorithms used to extract plot level phenotypes from these datasets.
Data were collected at the University of Arizona Maricopa Agricultural Center in Maricopa, Arizona. This site hosts a large field scanner with fifteen sensors, many of which are capable of capturing mm-scale images and point clouds at daily to weekly intervals.
These data are intended to be re-used, and are accessible as a combination of files and databases linked by spatial, temporal, and genomic information. In addition to providing open access data, the entire computational pipeline is open source, and we enable users to access high-performance computing environments.
The study has evaluated a sorghum diversity panel, biparental cross populations, and elite lines and hybrids from structured sorghum breeding populations. In addition, a durum wheat diversity panel was grown and evaluated over three winter seasons. The initial release includes derived data from from two seasons in which the sorghum diversity panel was evaluated. Future releases will include data from additional seasons and locations.
The TERRA-REF reference dataset can be used to characterize phenotype-to-genotype associations, on a genomic scale, that will enable knowledge-driven breeding and the development of higher-yielding cultivars of sorghum and wheat. The data is also being used to develop new algorithms for machine learning, image analysis, genomics, and optical sensor engineering.
2 Introduction
2.1 General information
- Title: TERRA-REF, An Open Reference Data Set From High Resolution Genomics, Phenomics, and Imaging Sensors
- Dates of Data Collection: 2017 and 2018
- Geographic Location: Maricopa, Arizona
- Center of the field: 33.07549∘∘ N 111.9749∘∘ W
- Field is approximately 0.4 ha (200 m x 20 m). The scannable area of the field is 22.1 m on East - West axis and 205.5 m on N/S axis.
- Keywords: Sensor, Phenomics, Sorghum, TERRA-REF
- Funding: The work presented herein was funded in part by the Advanced Research Projects Agency-Energy (ARPA-E), U.S. Department of Energy, under Award Number DE-AR0000598. Computational support was provided by the National Center for Supercomputing Applications and XSEDE.
The data pipeline used to process sensor data and generate derived data was described in the Burnette et al. (2018) ACM PEARC 2018 proceedings paper “TERRA-REF data processing infrastructure”.
2.2 Data Use, Sharing, and Access
To cite this dataset:
LeBauer, D.S., Burnette, M.A., Demieville, J., Fahlgren, N., French, A.N., Garnett, R., Hu, Z., Huynh, K., Kooper, R., Li, Z., Maimaitijiang, M., Mao, J., Mockler, T.C., Morris, G.P., Newcomb, M., Ottman, M., Ozersky, P., Paheding, S., Pauli, D., Pless, R., Qin, W., Riemer, K., Rohde, G.S., Rooney, W.L., Sagan, V., Shakoor, N., Stylianou, A., Thorp, K., Ward, R., White, J.W., Willis, C., and Zender C.S. (2020). TERRA-REF, An Open Reference Data Set From High Resolution Genomics, Phenomics, and Imaging Sensors. Dryad Digital Repository. http://doi.org/10.5061/dryad.4b8gtht99
This data publication consists of data, metadata, and a catalog of over 400 TB of files that are stored on a server at the National Center for Supercomputing Applications and made available through Globus on the ncsa#terra-public endpoint.
Except where clearly indicated for sensor data, the structure of directories that contain data and metadata refer to the contents of the ZIP files in the Dryad archive. This document describes the contents of the Dryad arcive, which includes directories organized in the following zip files:
metadata.zipcontains themetadata/directory. This includes information about experiments, sensors, and germplasm used in the study as well as comprehensive documentation.code.zipcontains thecode/directory. This includes code used to generate figures and tables in this README as well as instructions for running a copy of the trait database.trait_data.zipcontains thedata/traits/directory with one csv file for each plot level phenotype, described in {#phenotype-data}.sensor_data_catalogs.zipcontains thedata/sensors/directory. These catalogs provide an inventory of the files that are available using the Globus file transfer service. See {#sensor-data} for more information.
In addition to providing an archival data on Dryad, it is possible to browse and access these data through a variety of online portals. These online portals provide access to web user interfaces as well as databases, apis, and R and Python clients. In many cases it will be easier to access data through these portals using web interfaces and software libraries.
The TERRA REF documentation includes instructions for using these portals, and is hosted online at docs.terraref.org. The section “How to Access Data” provides an overview of methods that can be used to access data beyond what is provided in this repository. There is also a PDF copy of the documentation in the file metadata/docs.terraref.org_2020_04_06.pdf.
Tutorials for getting started with TERRA-REF data are available at terraref.org/tutorials and on GitHub at github.com/terraref/tutorials.
The TERRA-REF YouTube channel hosts 1) video walkthroughs of the tutorials https://www.youtube.com/channel/UComeQAqYR5aZrXN_3K5iFGw and 2) a playlist of videos related to the project https://www.youtube.com/playlist?list=PLNgRX4VLed8213stlJp60MvVx2p6VTv6N.
All data are released to the public domain under the CC-0 license. All original software are licensed with the BSD 3-clause or MIT/BSD compatible license. All software used for data processing have been archived on Zenodo and are available on GitHub in the terraref organization: github.com/terraref.
The software was created specifically for the field scanner data processing pipeline that is described by Burnette et al. (2018). The file code/source_code_dois.txt provides the DOIs for code archives that contain the state of the software at the time the data were processed.
| Component | Github Organization / Repository | Archive Citation |
|---|---|---|
| TERRA-REF Documentation | terraref/documentation | LeBauer, Willis, et al. (2020) |
| Reference Data | terraref/reference-data | LeBauer, Heyek, et al. (2020) |
| Sensor Metadata | terraref/sensor-metadata | Willis et al. (2020) |
| Computing Pipeline | terraref/computing-pipeline | Burnette et al. (2020) |
| terrautils Python Library | terraref/terrautils | Burnette, Willis, et al. (2019) |
| Metadata Processing | terraref/extractors-metadata | Burnette, LeBauer, Qin, et al. (2019) |
| Laser 3D Scanner | terraref/extractors-3dscanner | Burnette, ZongyangLi, et al. (2019) |
| Environmental Logger | terraref/extractors-environmental | Burnette, Mao, et al. (2019) |
| Hyperspectral | terraref/extractors-hyperspectral | Mao et al. (2019) |
| Multispectral, Thermal, PSII | terraref/extractors-multispectral | Burnette, LeBauer, Hajmohammadi, et al. (2019) |
| Stereo RGB | terraref/extractors-stereo-rgb | Burnette, LeBauer, Li, et al. (2019) |
Other Software used in this project:
| Software | Github Organization / Repository | Software Archive |
|---|---|---|
| Clowder | clowder-framework/clowder | Marini et al. (2019) |
| BETYdb Trait Database | pecanproject/bety | Rohde et al. (2016) |
3 Datasets
In this README, we define the following types of data:
- Sensor Data from five thermal, light, and shape imaging sensors scanning a 4000 m22 field at hourly to weekly intervals at 1 mm22 scale resolution. Additional details in the section on sensors and sensor technical descriptions that can be found in the
metadata/sensors/directory of this repository. - Phenotypes include both sensor-derived and standard field measurements required to validate and calibrate algorithms that compute plant phenotypes from remote sensing data.
- Environmental data include time series of meteorological variables including temperature, relative humidity, precipitation, wind direction and speed, photosynthetically active radiation, and downwelling spectral radiance.
- Genomics data include whole-genome resequencing data for 384 varieties from the sorghum Bioenergy Association Panel (BAP) and genotyping-by-sequencing data for 768 sorghum Recombinant Inbred Lines (RILs). Contains raw and derived sorghum genome sequencing data. Raw data includes DNA sequence files in compressed FASTQ format. Derived data are available in Variant Call Format (VCF) and Hapmap files.
3.1 Sensor Data
3.1.1 Field Scanner Sensors
This publication includes the following data generated by sensors. Detailed sensor and system details can be found in the file metadata/sensors_information.zip as well as browsed online through the Clowder Interface terraref.org/clowder in a space named “Maricopa Agricultural Center Device and Sensor Information”.
The sensor information folder contains extensive documentation for each of the sensors, the field scanner, calibration targets, and the results of sensor validation tests.
Additional sensors not represented in this version of the data are listed in the section on sensors in the section on additional sensors.
| Sensor Name | Model | Technical Specifications |
|---|---|---|
| Imaging Sensors | ||
| Stereo RGB Camera | Allied Vision Prosilica GT3300C | |
| Laser Scanner | Custom Fraunhofer 3D) | Spatial Resolution: 0.3 to 0.9 mm |
| Thermal Infrared | FLIR A615) | Thermal Sensitivity << 50mK @ 30∘∘C |
| PS II Camera | LemnaTec PS II Fluorescence Prototype) | Illumination 635nm x 4000 μμmol/m2/s, Camera 50 fps |
| Environmental Sensors | ||
| Environmental Sensors | Thies Clima 4.9200.00.000) | |
| VNIR Spectrometer | Spectral Evolution PSR+3500 | Range 350 to 800 nm |
| Environmental Sensors | Thies Clima 4.9200.00.000) | |
| VNIR Spectrometer | Spectral Evolution PSR+3500 | Range 350 to 800 nm |
| PAR Sensor | Quantum SQ–300 | Spectral Range 410 to 655 nm |
3.1.2 Sensor Data Products
The total size of raw (Level 0) data generated by these sensors is 60 TB. Combined, the Level 1 and Level 2 sensor data products are 490 TB. This size could be substantially reduced through compression and removal of duplicate data. For example, the same images at the same resolution appear in the georeferenced Level 1 files, the full field mosaics, and the plot level clip.
Sensor data are stored on the Storage Condo at the National Center for Supercomputing Applications in Urbana, Illinois. We make them available for download with the Globus file transfer system. The following steps are required to access them: 1) get an account at globus.org; 2) search for the terra-public endpoint; 3) install the Globus Personal Connect application and transfer data. Further information is provided in the data access chapter of the TERRA-REF documentation. As an alternative, the data can be provided on hard drives for the cost of supplies, labor, and shipping.
3.1.2.1 Sensor Data Catalog
Globus provides the easiest way to navigate the data. This archive also contains a catalog listing all of the files in the dataset. The catalog is one compressed ZIP file named sensor_data_catalogs.zip. This file includes one sub-directory for each season named sensors/season_[n]_catalog/. The compressed catalogs are 428 MB total, and expand to 5.4 GB when uncompressed. For each season’s catalog there is one directory per data product and one file per day named [data product]/file_catalog_season[n]_[data product]_[filetype]_[YYYY-MM-DD].json.
These catalog files contain the following information in JSON format:
collections: 'collection name [Data Product Name] - [YYYY-MM]'
    datasets: 'dataset name [Data Product Name] - [YYYY-MM-DD]'
        files:
            path: 'season-[n]/Level_[m]/[data_product]/[filename]'
            checksum: '[checksum_string]'
            name: '[data product]_L[m]_[YYYY-MM-DD]_[Scan Name]'
            size: 'bytes'
There is one collection per data product per month, and one dataset per data product per day. This structure of collections and datasets refers to the organization of files in the the Clowder database and web interface see data access documentation.
Below is a summary of the sensor data products included in the first release of TERRA-REF data. Sensor-derived phenotypes described in the Phenotype Data section were generated from the 3D laser scanner and RGB camera sensors as described in metadata/methods.csv.
| Data Product | Sensor | Algorithm | File Format | Plot Clip | Full Field |
|---|---|---|---|---|---|
| Environment | Thies Clima | envlog2netcdf | netcdf | NA | NA |
| Thermal Image | FLIR | ir_geotiff | geotiff | + | |
| Point Cloud | Fraunhofer Laser 3D | laser3d_las | las | + | |
| Point Cloud | Fraunhofer Laser 3D | scanner3DTop | ply | ||
| Images Time-Series | PSII Camera | ps2png | png | ||
| Color Images | RGB Stereo | bin2tiff | geotiff | + | + |
| Plant Mask | RGB Stereo | rgb_mask | geotiff | x |
Figure 3.1 shows the number of files for each data type across seasons 4 and 6.
Figure 3.1: Counts of individual files for each type of sensor data product.
3.1.2.2 Sensor Data Directory Contents
The following list describes the organization and contents of the Storage Condo server. These can be accessed at the ncsa#terra-public endpoint on Globus. Directory names have a leading / while file names do not.
- Environment Logger
/envlog_netcdf- Daily aggregated files named
envlog_netcdf_L1_ua-mac_[YYYY-MM-DD].nc. - There are also 24 hourly files for each day named
[YYYY-MM-DD_HH-MM-SS]_environmentlogger.nc.
- Daily aggregated files named
- Laser3D
/laser3d_las- One merged file per scan across the short (E-W) axis with names ending in
_merged.las. There are typically 50-100 of these each day.
- One merged file per scan across the short (E-W) axis with names ending in
/laser3d_las_plot- Each directory has the name of one plot, and there is one LAS file clipped to the plot boundaries for each scan (there may be more than one scan per day).
- RGB Stereo:
/rgb_geotiff- File names ending in
_left.tifand_right.tifrepresent simultaneous images from left and right stereo pair cameras.
- File names ending in
/rgb_mask- These images have the soil represented as black pixels. For each file ending in
*_left_mask.tifin the RGB Geotiff dataset, an image with black pixels representing areas that contain soil and not plants.
- These images have the soil represented as black pixels. For each file ending in
/rgb_geotiff_plots- For each RGB Geotiff image, a Geotiff file with the same dimensions as the plot. It contains the image clipped to the plot boundaries as well as fill values for parts of the plot not in the image.
/rgb_fullfield- Key data product is one full resolution full-field image per scan.
- Other files include: lower resolution versions of the full field (files with names ending in
_10pct.tif,_thumb.tifand.png); CSV files containing canopy cover values for each plot; a JSON file listing images contained in the fullfield mosaic; a VRT file that is a “virtual geotiff” that was used to generate the full-field mosaic. - These full field Geotiff images are RGB images and image masks tiled together to make up a full-field view. These full field images are not orthomosaics since they are not stitched together because doing so causes geometric aberrations.
- PSII Camera:
/ps2_png:- 101
.pngfiles per folder. The order of the images is indicated by the last four digits of the file name, i.e._0000.pngto_0100.png. - 101 georeferenced Geotiff files otherwise identical to the PNG counterparts.
- These files represent a time series of images captured at a rate of 50 frames per second.
- 101
3.1.2.3 Sensor Data Directory Structure and File Naming
File names follow consistent patterns based on data product and date of collection. These are intended to be easily understood. The hierarchy is season, data product level, date, date-time, and files.
Specifically, under the directory /season-[4,6] we have:
|-Level
|  |- Data product name
|  |  |-Date (YYYY-MM-DD)
|  |  |  |-Date-Time (YYYY-MM-DD__HH-MM-SS-SSS)
|  |  |  |  |- File name(s)
e.g.
|-Level_1
|  |- envlog_netcdf
|  |  |-2017-08-26
|  |  |  |- 2017-08-26_13-34-54-321_environmentlogger.nc
|  |- laser3d_las
|  |  |-2017-08-26
|  |  |  |-2017-08-26__12-34-54-321
|  |  |  |  |- scanner3DTop - 2017-08-26__12-34-54-321 MergedPointCloud.las
For convenience, we have pre-processed some images and point clouds to plot boundaries and have organized them by Date and then Plot name, e.g.:
|-Level_1_plots
|  |- rgb_geotiff
|  |  |- 2017-04-26
|  |  |  |- MAC Field Scanner Season 4 Range 21 Column 16
|  |  |  |  |- rgb_geotiff_L1_ua-mac_2017-04-26__12-56-14-907_right.tif
|  |  |  |  |- rgb_geotiff_L1_ua-mac_2017-04-26__12-56-14-907_left.tif
|  |  |  |  |- rgb_geotiff_L1_ua-mac_2017-04-26__12-53-34-106_right.tif
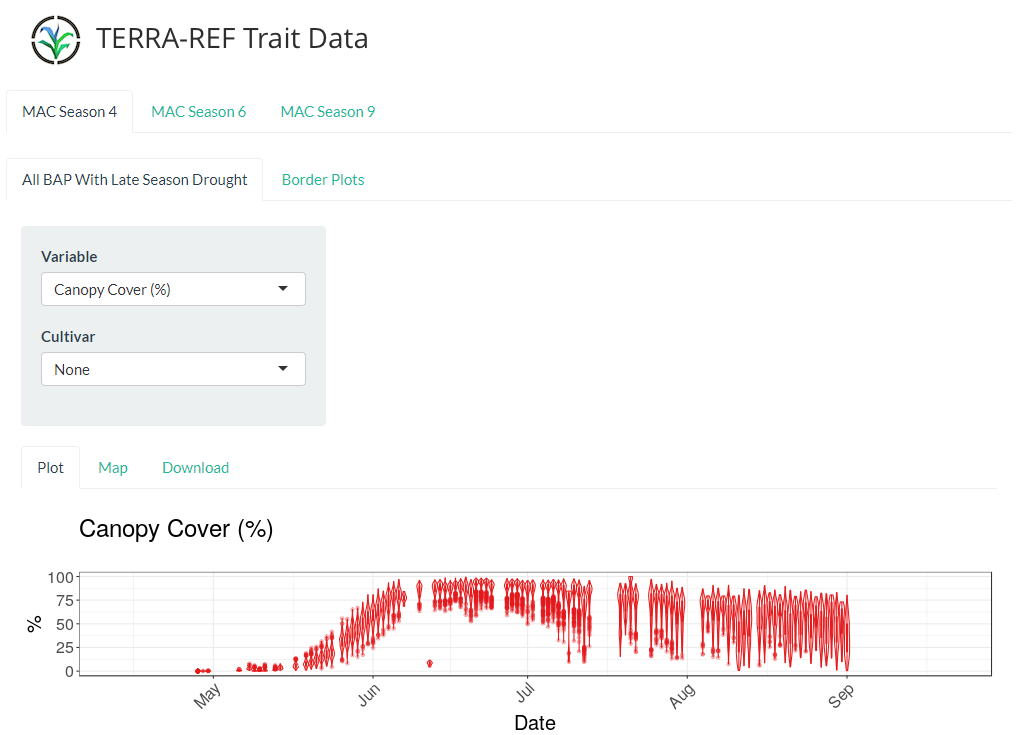
3.2 Phenotype Data
3.2.1 Raw Phenotype Data
Tables of phenotypes can be found in the compressed files named traits/season_[n]_traits/ folder inside the trait_data.zip file. There is one subdirectory for each of seasons 4 and 6. Once uncompressed, each directory will contain one CSV file for each combination of trait and measurement method. The names of these CSV files help identify the contents because they follow the pattern season_[n]_[trait]_[measurement_type].csv. For example, the file season_6_aboveground_biomass_manual.csv contains manual measurements of above-ground biomass taken during season 6.
These CSV files have one measurement per row for a specific date, location, genotype, and measurement. The first line is a header that contains the names of the fields:
- plot (text) Plot name, using the format
<field site> Season <n> Range <m> Column <k>. - scientificname (text) Latin name for the crop species. This will always be Sorghum bicolor until future versions with data from additional crops are published.
- genotype (text) Genotype or accession identifier.
- treatment (text) Name of experimental treatment.
- date: (YYYY-MM-DD) Date of measurement.
- trait: (text) Name of the trait measured. Defined in the file
metadata/variables.csv. - method: (text) The method used to measure the trait. Defined in the file
metadata/methods.csv. - mean: (numeric) Value of the phenotype data.
- checked: (boolean) 0 = unchecked and 1 = checked: has the data been independently reviewed?
- author: (text) name of scientist who collected the data or who wrote the algorithm used to derive phenotypes from sensor data.
- season: (text) Name of season: one of ‘Season 4’ or ‘Season 6’.
- method_type: (text) Type of measurement: one of ‘manual’ or ‘sensor’.
(#fig:trait_counts)Counts of individual plot level measurements for each trait.
3.2.2 Code
For the purposes of reproducibility, the code used to run and query data from a copy of the TERRA REF trait database terraref.org/bety is provided. This uses Docker to run the database and R to query the data and prepare the CSV files. The code/ directory contains the following:
- An R script
s4s6_sql2csv.Rthat connects to the database and generates the phenotype data files described above. This requires a copy of the database. Instructions for installing the database using Docker are found inbetydb_docker. A much slower implementation that uses the API and the R traits package Chamberlain et al. (2019) is provided incode/s4s6_slow_api.R. - The
betydb_docker/folder that contains files namedDocker,docker-compose.yml,README.mdand.pgpass. This allows a user to run a copy of the TERRA REF PostgreSQL database containing phenotype data and agronomic metadata. Instructions are in theREADME.mdfile and database connection parameters are in the.pgpassfile. This database can be queried using the included R script or from any programming language using the credentials stored in the.pgpassfile.
3.3 Environmental Data
3.3.1 Weather
We have data from two stations, AZMet and the field scanner system.
3.3.1.1 Field Scanner System “Environment Logger”
These data are from the Theis-Clima weather station mounted on the field scanner. The Environment Logger has more sensors and provides high temporal resolution data than the weather station. In the NetCDF files, data is recorded at five seconds intervals. This logger also collects the downwelling solar radiation every five seconds at a spectral resolution of 0.5 nm. The sensors and data collection frequency are described in the section on sensor data. We describe both the full resolution data provided as NetCDF files in the sensor data product named “envlog_netcdf” and the 5–minute aggregated data provided here as JSON files that were accessed using the Geostreams API as described in the TERRA REF tutorials. These time series are not continuous, as can be seen in Figure 3.2.
3.3.1.1.1 Environment Logger Aggregated JSON Files
The files metadata/weather/envlog_aggregated/season_[n]_envlog.json were downloaded from the Geostreams API on April 21 2020. The API is described in the tutorials, and the specific calls used to download these files are in code/envlog_curl.sh.
Figure 3.2: Dates of aggregated weather data - avaialable through the Geostreams API and in the metadata/weather folder.
3.3.1.1.2 Environment Logger NetCDF Files
These are even higher resolution time series.
The files for each season are approximately 40 GB and, like sensor data, are provided using methods such as Globus transfer or the Clowder API (see “How To Access Data” in the documentation). On Globus, they are in the /ua-mac/Level_1/envlog_netcdf/ directory.
The data are described in the TERRA REF documentation under the environmental data section of the data products chapter.
The primary reason that these files are so large is that they contain the downwelling spectral radiance measurements (350-800 nm) at five second intervals.
On Globus, each date will include hourly files named [YYYY-MM-DD_HH-MM-SS]_environmentlogger.nc and as a single daily file named envlog_netcdf_L1_ua-mac_[YYYY-MM-DD].nc. The daily file contains all of the hourly files concatenated into a single file for ease of use.
3.3.2 AZMET
These gap-filled and corrected data have been provided for convenience. When using these data, users must cite Brown and Russell (1996): > Brown, P. W., & Russell, B. (1996). AZMET, The Arizona Meteorological Network. Arizona Cooperative. website: https://cals.arizona.edu/AZMET/.
Both hourly and daily values are available, and can be found in the /metadata/weather/azmet folder of the Dryad repository. There are four CSV files – one daily and one hourly for each season, and a README file that provides a description of their content. These files have not been modified from the collection on the website other than to subset it to the time range of the two seasons of sensor and phenotype data.
3.3.3 Soils Data
A comprehensive analysis of soil physical properties will be published alongside the TERRA-REF datasets (Babaeian et al. 2020).
3.4 Genomics Data
The Biomass Association Panel planted in Seasons 4 and 6 was described by Brenton et al. (2016). These genotypes have been sequenced and the sequence data and SNPs are provided as an archive on Dryad. A copy of these data is available on the CyVerse Data Store https://datacommons.cyverse.org/browse/iplant/home/shared/terraref.
The genomics dataset includes raw and derived sorghum genome sequencing data from the TERRA-REF project. Raw data includes DNA sequence files in compressed FASTQ format. Derived data is available for whole-genome resequencing and genotyping-by-sequencing.
These data are archived in the same filesystem as the sensor data, and available at the Globus ncsa#terra-public endpoint under the genomics/ directory. A copy of this copy is available in the CyVerse data store.
At both Globus and CyVerse, the data is organized in the following directory structure:
|-data
|  |-genomics
|  |  |-raw_data
|  |  |  |-bap
|  |  |  |  |-resequencing
|  |  |  |-ril
|  |  |  |  |-gbs
|  |  |-derived_data
|  |  |  |-bap
|  |  |  |  |-resequencing
|  |  |  |  |  |-danforth_center
|  |  |  |-ril
|  |  |  |  |-gbs
|  |  |  |  |  |-kansas_state
3.4.1 Germplasm
A list of cultivars and the experiments in which they are planted are listed in the file metadata/germplasm.csv.
The germplasm.csv file contains the following fields:
- germplasmName Genotype identifier used by TERRA REF; typically equal to Genesys Accession Number
- germplasmPUI UUID from Genesys
- season_4 A boolean which is TRUE if the accession was planted in Season 4 experiments.
- season_6 A boolean value which is TRUE if the accession was planted in Season 6 experiments.
For user convenience, we also provide this information and additional metadata in a format that follows the Breeder’s API (BrAPI) specification v1.3 Selby et al. (2019) in files named season_[n]_germplasm.json and in the terraref_sorghum_bap_samples.txt table alongside raw sequencing data (described below).
3.4.2 Whole-genome resequencing data for the sorghum Bioenergy Association Panel (BAP)
3.4.2.1 Raw data
There are 384 available samples. Each sample is stored as a pair of files in bzip2 FASTQ format with names ending in *_R1.fastq.bz2 and *_R2.fastq.bz2. R1 and R2 in these names represent read pairs one and two. Each file in a pair has the same number of DNA sequences that line up and are read from opposite ends of the same sequenced molecule.
A table of sample information (terraref_sorghum_bap_samples.txt) can be found in the raw data directory genomics/raw_data/bap/resequencing.
Each table contains the following fields:
- identifier: The unique genotype identifier that will be used in the derived data outputs
- accession: Genotype identifier used by TERRA REF
- taxid: Taxonomy identifier from the NCBI taxonomy database
- organism common name: Genbank common name from the NCBI taxonomy database
- subspecific genetic lineage rank: Cultivar
- subspecific genetic lineage name: Unique germplasm identifier
- ploidy: Source, Phytozome
- number of replicons: Number of chromosomes, source Phytozome
- estimated size: Estimated genome size, source Phytozome
- source material identifiers: UUID from Genesys
- sample name: Internal sample identifier
- raw file 1: File name for read-pair 1
- raw file 2: Filename for read-pair 2
3.4.2.2 Derived data
Data derived from analysis of the raw resequencing data at the Danforth Center (version1) are available as gzipped, genotyped variant call format (gVCF) files and the final combined hapmap file in the derived data directory, genomics/derived_data/bap/resequencing/danforth_center/version1.
3.4.3 Genotyping-by-sequencing (GBS) data for sorghum recombinant inbred lines (RIL)
3.4.3.1 Raw data
Raw data are in gzip FASTQ format. There are 768 available samples.
A key file (Key_ril_terra) with sample information can be found in the raw data directory, genomics/raw_data/ril/gbs.
3.4.3.2 Derived data
Combined genotype calls are available in VCF format in the derived data directory,genomics/derived_data/ril/gbs/kansas_state/version1.
3.5 Future Releases
For the first public release of data we have focused on a subset of the data that we collected, processed, and subjected to quality assurance and control. We expect that this initial data release and subsets of these data curated for specific research projects will provide users and funders with sufficient information to justify processing, validating, and storing data from additional seasons and sensors.
Here we provide a description of additional data that can be made available for future use.
This data release does not contain all of the data that was collected during the TERRA-REF project. The field scanner was operated as part of the TERRA-REF program with the mission of generating open access data from April 2016 to September of 2019. Although this release focuses on two seasons of data, the first priority is to make all of the raw data and metadata is available in the public domain. This raw data archive is in the process of being transferred to tape-storage at the Texas Advanced Computing Center and we expect it will be available in late 2020.
Additional derived products from the project are also available for use, but are not in the public domain because they have not been consistently curated, processed, and validated. These data are available for use - researchers interested in using these data or creating new datasets are invited to contact the authors for more information. The primary constraint on processing and publishing these datasets is the availabilty of scientists and engineers to process and validate the data.
Any use of these unpublished derived datasets must adhere to the data use and authorship guidelines outlined in the TERRA-REF documentation at docs.terraref.org and the file documentation/docs.terraref.org_2020_04_06.pdf.
3.5.1 Additional Sensors Not Included in the Current Data Release
At this point we have not sufficiently validated data or curated data from the following sensors. For the VNIR and SWIR hyperspectral imaging cameras this reflects challenges faced in calibration. Other sensors have not been prioritized.
| Sensor Name | Model | Technical Specifications |
|---|---|---|
| Multi-spectral Radiometers | ||
| Dedicated NDVI Multispectral Radiometer | Skye Instruments SKR 1860D/A | 650 nm, 800 nm +/- 5 nm; 1 down, 1 up |
| Dedicated PRI Multispectral Radiometer | Skye Instruments SKR 1860ND/A | 531nm +/- 3nm; PRI = Photochemical Reflectance Index |
| Active Reflectance | Holland Scientific Crop Circle ACS-430 | 670 nm, 730 nm, 780 nm |
| VNIR Spectroradiometer | Ocean Optics STS-Vis | Range: 337-824 nm @ 1/2 nm |
| Hyper-spectral Cameras | ||
| VNIR Hyperspectral Imager | Headwall Inspector VNIR | 380-1000 nm @ 2/3 nm resolution |
| SWIR Hyperspectral Imager | Headwall Inspector SWIR | 900-2500 nm @ 2/3 nm resolution |
| Environmental | ||
| SWIR Spectrometer | Spectral Evolution PSR+ | Range 800-2500nm; Installed 2018 |
| Open Path CO2 Sensor | Vaisala CARBOCAP Carbon Dioxide Probe GMP343 | Range: 0-1000 ppm |
3.5.2 Additional Seasons Not Included in the Current Data Release
| Season | Crop | Experiments | Populations33 | Planting Date | Harvest |
|---|---|---|---|---|---|
| 1 | Sorghum | Density | BAP, RIL | 2016-04-20 | 2016-07-16 |
| 2 | Sorghum | Uniformity Trials34 | Stay Green RILs F10 | 2016-07-27 | 2016-12-02 |
| 3 | Durum Wheat | Diversity Panel | 2016-12-15 | 2017-04-05 | |
| 4 | Sorghum | Late Season Drought | 2017-04-13 | 2017-09-21 | |
| 5 | Durum Wheat | Diversity Panel | 2017-11-20 | 2018-04-05 | |
| 6 | Sorghum | BAP | 2018-04-20 | 2018-08-02 | |
| 7 | Sorghum | Hybrid Uniformity Blocks | Stay Green RILs, Mutants, F2 families | 2018-08-23 | 2018-11-01 |
| 8 | Durum Wheat | Uniformity Trials | Diversity Panel | 2019-01-01 | 2019-03-31 |
| 9 S | Sorghum | GRASSL x RIO RILs | 2019-05-01 | 2019-07-28 | |
| 9 N35 | Sorghum | SAP | 2019-04-29 | 2019-09-05 | |
Babaeian, Ebrahim, Juan R. Gonzalez-Cena, Mohammad Gohardoust, Xiaobo Hou, Scott A. White, and Markus Tuller. 2020. “Physicochemical and Hydrologic Characterization Terra-Ref South Field.” In Prep.
Brenton, Zachary W., Elizabeth A. Cooper, Mathew T. Myers, Richard E. Boyles, Nadia Shakoor, Kelsey J. Zielinski, Bradley L. Rauh, William C. Bridges, Geoffrey P. Morris, and Stephen Kresovich. 2016. “A genomic resource for the development, improvement, and exploitation of sorghum for bioenergy.” Genetics. https://doi.org/10.1534/genetics.115.183947.
Brown, P. W., and B. Russell. 1996. “AZMET, the Arizona Meteorological Network. Arizona Cooperative Extension.” https://cals.arizona.edu/AZMET/.
Burnette, Max, David LeBauer, Solmaz Hajmohammadi, Zongyang Li, Craig Willis, Wei Qin, Patrick, and JD Maloney. 2019. terraref/extractors-multispectral: Season 6 Data Publication (2019) (version S6_Pub_2019). Zenodo. https://doi.org/10.5281/zenodo.3406311.
Burnette, Max, David LeBauer, Zongyang Li, Wei Qin, Solmaz Hajmohammadi, Craig Willis, Sidke Paheding, and Nick Heyek. 2019. terraref/extractors-stereo-rgb: Season 6 Data Publication (2019) (version S6_Pub_2019). Zenodo. https://doi.org/10.5281/zenodo.3406304.
Burnette, Max, David LeBauer, Wei Qin, and Yan Liu. 2019. terraref/extractors-metadata: Season 6 Data Publication (2019) (version S6_Pub_2019). Zenodo. https://doi.org/10.5281/zenodo.3406329.
Burnette, Max, Jerome Mao, David LeBauer, Charlie Zender, and Harsh Agrawal. 2019. terraref/extractors-environmental: Season 6 Data Publication (2019) (version S6_Pub_2019). Zenodo. https://doi.org/10.5281/zenodo.3406318.
Burnette, Maxwell, Gareth S. Rohde, Noah Fahlgren, Vasit Sagan, Paheding Sidike, Rob Kooper, Jeffrey A. Terstriep, et al. 2018. “TERRA-REF data processing infrastructure.” In ACM International Conference Proceeding Series. https://doi.org/10.1145/3219104.3219152.
Burnette, Max, Craig Willis, Chris Schnaufer, David LeBauer, Nick Heyek, Wei Qin, Solmaz Hajmohammadi, and Kristina Riemer. 2019. terraref/terrautils: Season 6 Data Publication (2019) (version S6_Pub_2019). Zenodo. https://doi.org/10.5281/zenodo.3406335.
Burnette, Max, Charlie Zender, JeromeMao, David LeBauer, Rachel Shekar, Noah Fahlgren, Craig Willis, et al. 2020. terraref/computing-pipeline: Season 4 & 6 Data Publication (2019) (version S46_Pub_2019). Zenodo. https://doi.org/10.5281/zenodo.3635849.
Burnette, Max, ZongyangLi, Solmaz Hajmohammadi, David LeBauer, Nick Heyek, and Craig Willis. 2019. terraref/extractors-3dscanner: Season 6 Data Publication (2019) (version S6_Pub_2019). Zenodo. https://doi.org/10.5281/zenodo.3406332.
Chamberlain, Scott, Zachary Foster, Ignasi Bartomeus, David LeBauer, Chris Black, and David Harris. 2019. Traits: Species Trait Data from Around the Web. https://CRAN.R-project.org/package=traits.
LeBauer, David, Nick Heyek, Rachel Shekar, Katrin Leinweber, JD Maloney, and Tino Dornbusch. 2020. terraref/reference-data: Season 4 & 6 Data Publication (2019) (version S46_Pub_2019). Zenodo. https://doi.org/10.5281/zenodo.3635863.
LeBauer, David, Craig Willis, Rachel Shekar, Max Burnette, Ting Li, Scott Rohde, Yan Liu, et al. 2020. terraref/documentation: Season 6 Data Publication (2019) (version v0.9). Zenodo. https://doi.org/10.5281/zenodo.3661373.
Mao, Jerome, Max Burnette, Henry Butowsky, Charlie Zender, David LeBauer, and Sidke Paheding. 2019. terraref/extractors-hyperspectral: Season 6 Data Publication (2019) (version S6_Pub_2019). Zenodo. https://doi.org/10.5281/zenodo.3406312.
Marini, Luigi, Rob Kooper, Indira Gutierrez, Constantinos Sophocleous, Max Burnette, Todd Nicholson, Michal Ondrejcek, et al. 2019. Clowder: Open Source Data Management for Long Tail Data (version v1.7.1). Zenodo. https://doi.org/10.5281/zenodo.3300953.
Rohde, Scott, Carl Crott, Patrick Mulroony, Jeremy Kemball, David LeBauer, Rob Kooper, Jimmy Chen, et al. 2016. Bety: BETYdb 4.6. Zenodo. https://doi.org/10.5281/zenodo.48661.
Selby, Peter, Rafael Abbeloos, Jan Erik Backlund, Martin Basterrechea Salido, Guillaume Bauchet, Omar E Benites-Alfaro, Clay Birkett, et al. 2019. “BrAPI—an application programming interface for plant breeding applications.” Bioinformatics 35 (20): 4147–55. https://doi.org/10.1093/bioinformatics/btz190.
Willis, Craig, David LeBauer, Max Burnette, and Rachel Shekar. 2020. terraref/sensor-metadata: Season 4 & 6 Data Publication (2019) (version S46_Pub_2019). Zenodo. https://doi.org/10.5281/zenodo.3635853.
-
University of Arizona, orcid:0000-0001-7228-053X↩
-
NCSA, University of Illinois at Urbana-Champaign, orcid:0000-0002-1786-3676↩
-
University of Arizona, orcid:0000-0002-7725-7379↩
-
Donald Danforth Plant Science Center, orcid:0000-0002-5597-4537↩
-
USDA Agricultural Research Service, orcid:0000-0002-4018-1817↩
-
Washington University in St. Louis, orcid:0000-0002-0152-5453↩
-
Kansas State University, orcid:0000-0002-1500-1255↩
-
University of Arizona, orcid:0000-0003-3360-4073↩
-
NCSA, University of Illinois at Urbana-Champaign, orcid:0000-0002-5781-7287↩
-
Donald Danforth Plant Science Center, orcid:0000-0002-8601-378X↩
-
Saint Louis University, orcid:0000-0001-6153-1583↩
-
University of California at Irvine, current:Case Western Reserve University orcid:0000-0003-2505-8666↩
-
Donald Danforth Plant Science Center, orcid:0000-0002-0462-5775↩
-
Kansas State University, orcid:0000-0002-3067-3359↩
-
University of Arizona, current:USDA Forest Service, orcid:0000-0003-2974-9149↩
-
University of Arizona, orcid:0000-0003-0763-3073↩
-
Danforth Plant Science Center, orcid:0000-0002-8942-0524↩
-
Saint Louis University, orcid:0000-0003-4712-9672↩
-
University of Arizona, orcid:0000-0002-8292-2388↩
-
George Washington University, orcid:0000-0001-5775-8216↩
-
University of Illinois at Urbana-Champaign, current:Amazon.com, Inc, orcid:0000-0003-4816-6336↩
-
University of Arizona, orcid:0000-0003-3802-3331↩
-
University of Illinois at Urbana-Champaign, orcid:0000-0001-9030-0936↩
-
Texas A&M University, orcid:0000-0001-7953-1856↩
-
Saint Louis University, orcid:0000-0003-4375-2096↩
-
Donald Danforth Plant Science Center, orcid:0000-0002-2035-7117↩
-
Saint Louis University, orcid:0000-0002-4387-028X↩
-
USDA Agricultural Research Service, orcid:0000-0001-9168-875X↩
-
University of Arizona, current:unaffiliated , orcid:0000-0003-4436-0019↩
-
USDA Agricultural Research Service, current:University of Florida, orcid:0000-0002-2051-4645↩
-
University of Illinois at Urbana-Champaign, orcid:0000-0002-6148-7196↩
-
University of California, Irvine, orcid:0000-0003-0129-8024↩
-
RIL = Recombinant Inbred Lines, BAP = Bioenergy Association Panel, SAP = Sorghum Association Panel↩
-
Uniformity Trial = same lines planted in strips across field.↩
-
In season 9 a second field ‘North’ was added, and separate trials were conducted↩